eilishrose.github.io

Hello World
A GitHub site for my current projects.
5003 Report
Click here to access the repo on github
Software intention
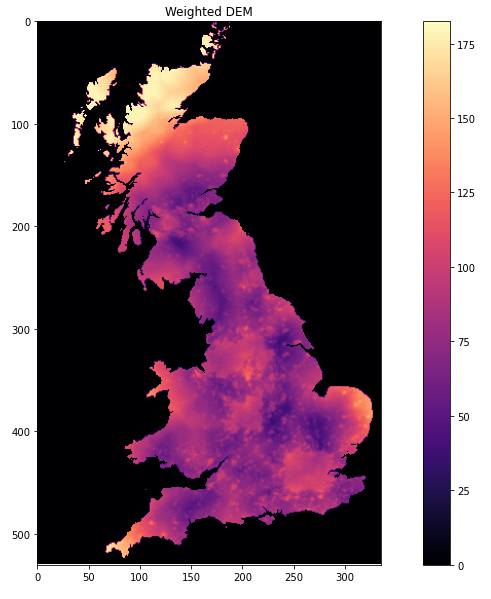
The intention of the software is to create a Jupyter Notebook that creates a weighted DEM based on three files representing geology, transportation, and population. The Jupyter Notebook is deigned to take in user defined variables, create an output map displaying the weighted DEM, and allow users to access the output file with the inclusion of code to export the file. The notebook also contains code at the end of the notebook that re-imports the output file to make sure that the export has executed correctly.
Issues during development and resolutions
Choosing and implementing a method of getting user input variable information
Initially I worked from the provided module materials and worked to get a user interface pop up in the form of a Tkinter window, however I found the interface to be clunky. I looked into how to implement a slider within Jupyter Notebooks and found the iPyWidget package. I chose to use this package within my report as it used a small amount of code to create the sliders, and it created an easy reference to the user input variables (.values) which is used later to create the weighting.
Adding together three NumPy arrays
Another issue that I faced that I could not fully fix, is adding together the three Numpy arrays. The issue I faced is that the sum() function only took in 2 arguments, and so I added together the 3 arrays by adding two together as a variable and then added the variable and the other array. This is not the most efficient way of doing this, but I struggled finding any documentation on simply adding 3 NumPy arrays together.
Getting code to run from the middle of the notebook
I wanted to be able to set the position that the code runs from, as re-running all cells would reset the values of the slider and running cell by cell would have been time consuming. I thought about pulling all the code together into one last cell, but I wanted to keep the different elements of the code separate so that it was easier to understand and looked tidier. I found a useful piece of code which imported the JavaScript element of the iPyWidgets package and split the code. The first section of the code runs at the start of the report, away from the cells that the user interacts with, and the button is input at the bottom after the widget slider. At a push of a button, after setting the slider, the user can re-run the map weighting and produce a csv output.
Sources
iPyWidgets
MatPlotLib
Other
Adding in JS script to execute cells below button
Software development process followed
I initially started compiling the code within Spyder for testing purposes, working with the CSV import code used in the first assignment, however I hit some issues with the data type when importing, and decided on using NumPy instead to handle the data within the provided CSV files. Using NumPy, I was able to import the files with a smaller amount of code.
I then looked at how I would display the data. I initially decided on using Tkinter to create a pop out window and would then add the variable linked scrollbar. Looking through the Tkinter documentation, I found this would have been very clunky, and decided to look at other ways of displaying the data and implementing scrollbars.
I moved the code out of Spyder and started working directly in Jupyter Notebook. I transferred my code over and decided on using the iPyWidgets scrollbars. The values created by the scrollbars could be easily referenced, and they were easy to edit and add into the notebook using the iPyWidgets documentation.
The calculations for the weightings are very simple, multiplying each value in the layer by the slider value, and adding these three resulting layers together. Then the layer is normalised by dividing the total output by 100, to bring the values back down to between 0 and 255. One issue that I came across which I could not find a good solution for was the issue of adding three arrays together. The NumPy sum() could only take in three arguments.
Instead of continuing to use the Tkinter pop out for the map, I decided on using the ‘in cell’ display of matplotlib, to match the sliders that were also integrated into the notebook.
As mentioned in the ‘Issues’ section, I added in a small piece of code to run the cells below the cell that had the button in, preserving the slider values and avoiding running the cells after the slider individually.
